This article breaks down the average playing stats for 5 handicap golfers, based on analysis of 3,788 rounds from 1,116 golfers. The data shows not just averages but the minimum (10th percentile) and elite (90th percentile) ranges—giving you realistic targets for every area of your game.
📊 5 Handicap Stats At-a-Glance:
- Average Score: 79.0 (range: 74-84)
- Driving Distance: 258 yards (range: 225-290)
- Fairway Accuracy: 51.0% (range: 29-70%)
- Greens in Regulation: 46.1% (range: 28-61%)
- Up & Down Success: 37.7% (range: 20-60%)
- Putts per Round: 32.5 (range: 29-36)
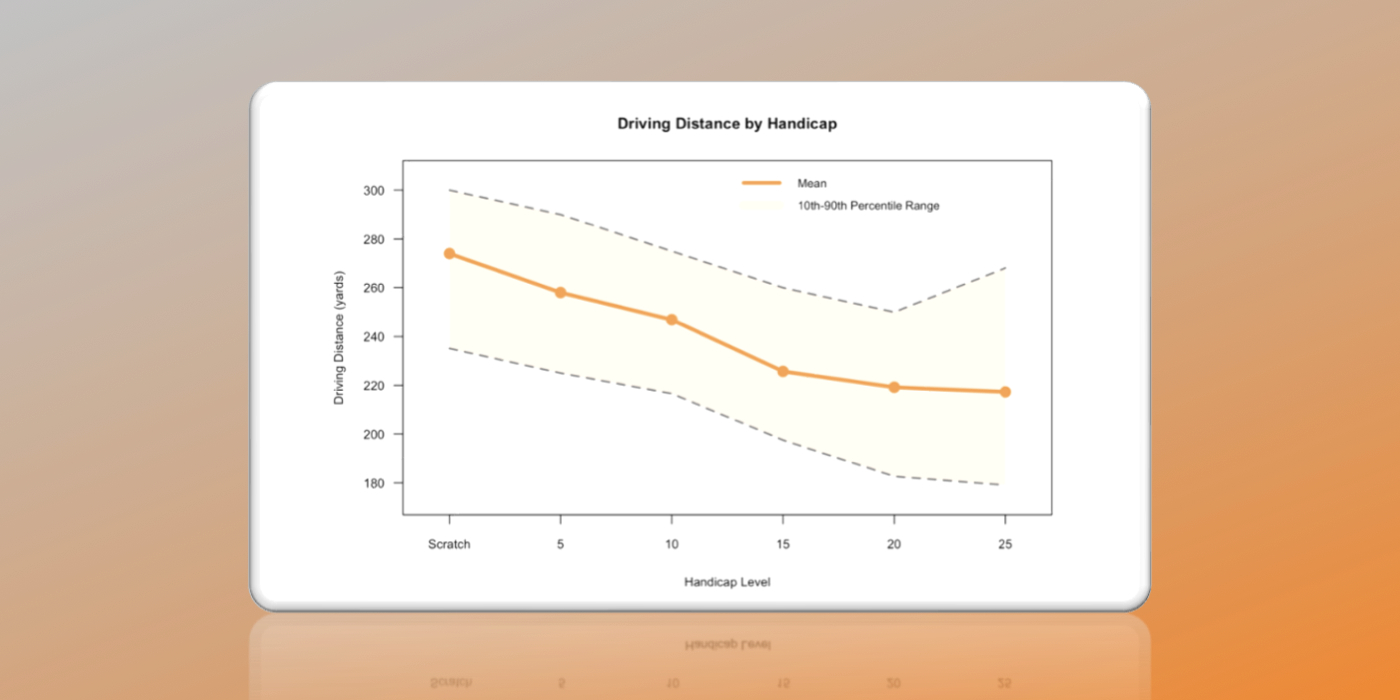
How Far Do 5 Handicap Golfers Drive the Golf Ball?
Five handicap golfers average 258 yards off the tee, with a realistic range from 225 yards (10th percentile) to 290 yards (90th percentile). The 10th percentile gives you a good estimate of the minimum distance needed to maintain a 5 handicap golf—consistently hitting below 225 yards makes reaching par 5s in two and longer par 4s challenging.
Compared to scratch golfers (274 yards average), 5 handicappers lose 16 yards per drive. That is almost two clubs extra into every green and over 14 driving holes; this really adds up. Against 10 handicappers (247 yards), the advantage is 11 yards per drive. These gaps compound throughout the round.
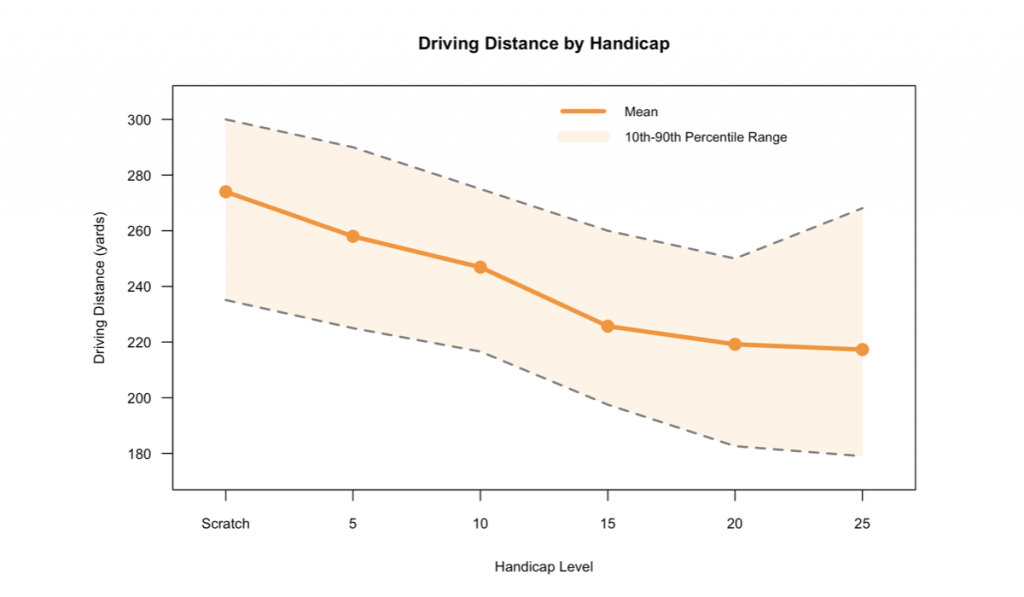
How Accurate Are 5 Handicap Golfers Off the Tee?
Five handicap golfers find 51.0% of fairways, with a range from 29% to 70% for good and bad rounds. Hitting fewer than 29% of fairways (roughly 4 per round) makes maintaining a 5 handicap extremely difficult, but even 5 handicappers have bad days off the tee.
Scratch golfers hit 56.5% of fairways—5.5 percentage points more—whilst maintaining 16 extra yards of distance. Ten handicappers manage 49.3%, just 1.7 percentage points fewer. The accuracy difference to 10 handicap is minimal, but the distance gap (11 yards average) separates the levels. Five handicaps find the short grass whilst generating more distance.
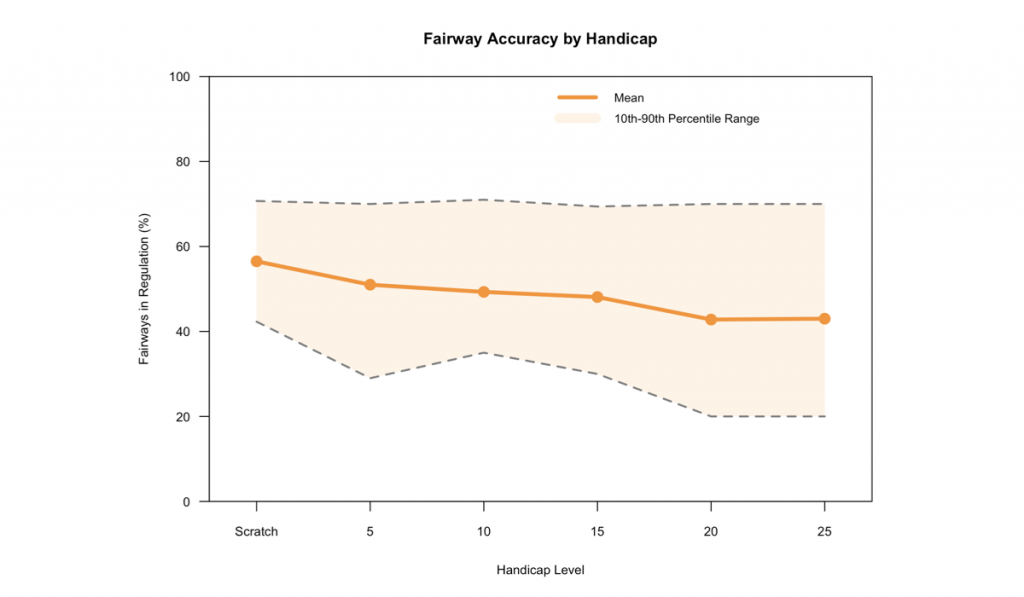
How Many Greens Do 5 Handicap Golfers Hit?
Five handicap golfers hit 46.1% of greens in regulation—roughly 8 greens per round. Their performance range runs from 28% (poor round) to 61% (great round). Consistently hitting fewer than 8 greens per round signals your approach play needs work if you want to become a 5 handicap.
This is where scratch golfers pull away. At 56.8% GIR, scratch players average two more greens per round than 5 handicaps. Ten handicappers hit 37.3% of greens (6.7 per round)—nearly 9 percentage points fewer. To reach a 5 handicap or scratch, closing the GIR gap matters more than any other metric.
How Good Are 5 Handicap Golfers Around the Green?
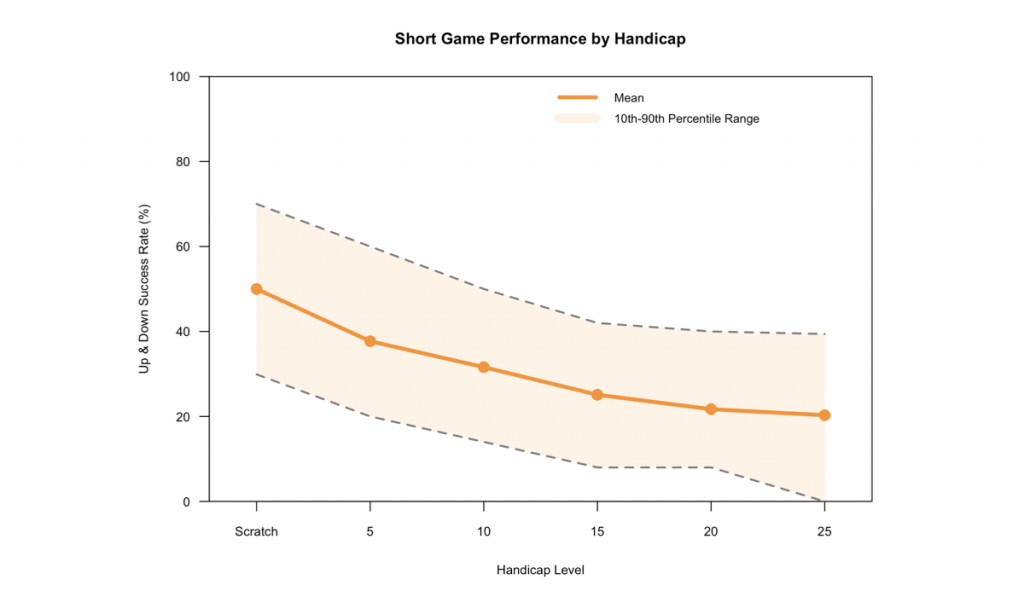
Five handicap golfers convert 37.7% of up-and-downs, with performance ranging from 20% (poor round) to 60% (great round). At this level, you’re getting up and down roughly 1 in 3 times.
Scratch golfers succeed 50.0% of the time—12.3 percentage points more. That’s roughly one additional scramble per round, worth 1-2 strokes. Ten handicappers convert just 31.6% of up and down chances, showing a clear difference in short game performance between 10, 5 and scratch golfers.
With 10 missed greens per round on average by 5 handicap golfers, every percentage point in scrambling matters. Drop below 20% conversion, and you’re leaving 3-4 shots on the course through poor short game.
How Many Putts Do 5 Handicap Golfers Average?
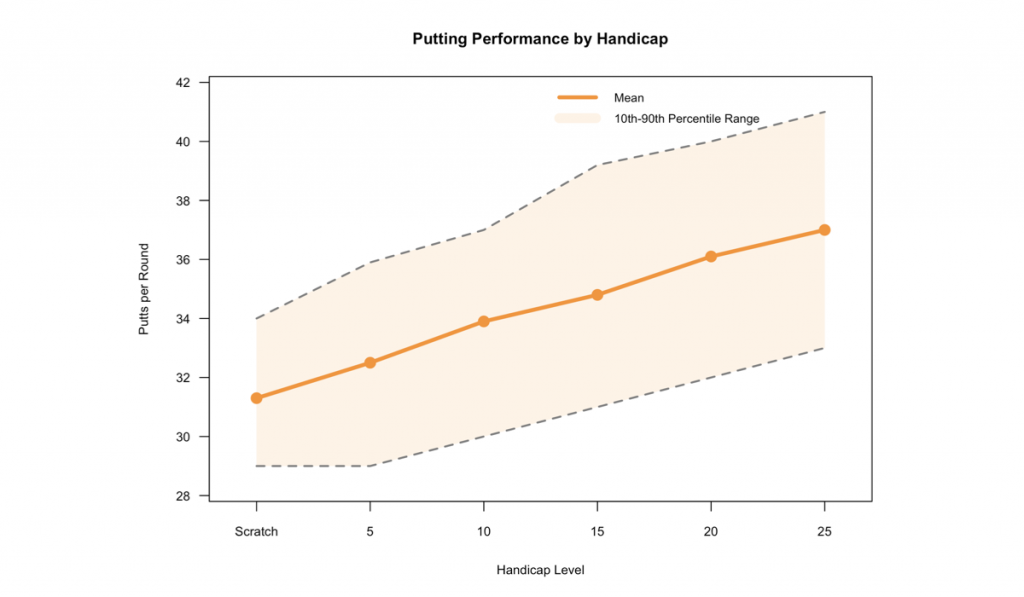
Five handicap golfers average 32.5 putts per round, ranging from 29 (excellent round) to 36 (poor round).
Scratch golfers average 31.3 putts—just 1.2 fewer. Ten handicappers require 33.9 putts, giving 5 handicaps a 1.4-putt advantage.
The differences appear small, but remember that 5 handicaps hit 8 greens whilst 10 handicaps hit 6.7. Five handicaps hit more greens in regulation and, as a result, have longer putts on average. The putting improvement from 10 to 5 handicap is real but modest compared to approach play gains.
What Do 5 Handicap Golfers Typically Score?
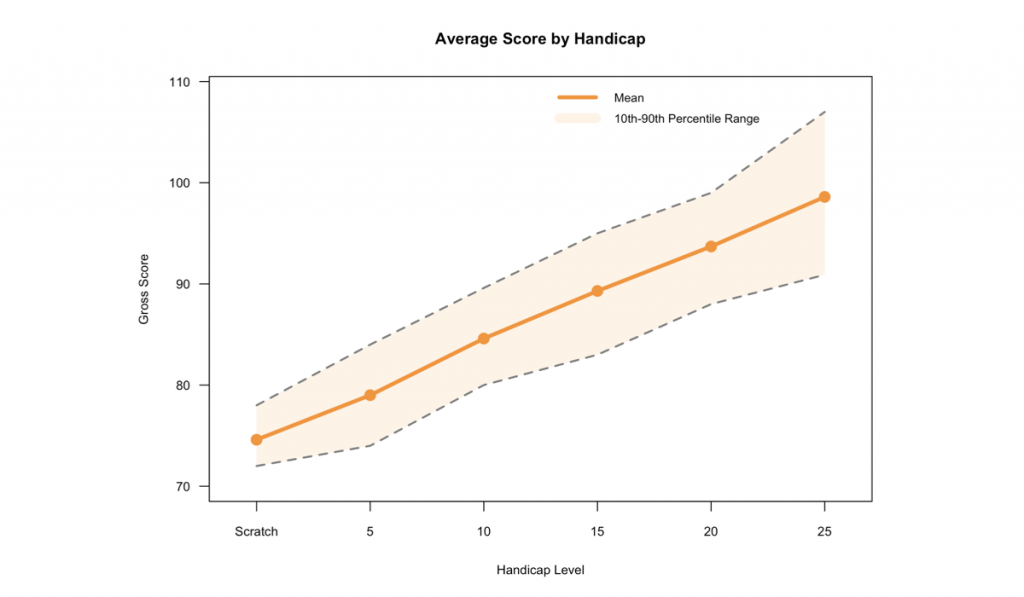
Five handicap golfers average 79.0, with a typical scoring range from 74 to 84. The 10-shot variance shows that even 5 handicap golfers struggle with consistency —good rounds dip near even par, whilst off days can reach mid-80s.
Track Your Stats and Improve
Want to track your playing stats and get a personalised practice plan to hit these targets? Break X Golf builds custom practice plans based on your actual performance data.