Getting better at golf is about learning how to score. Understanding what golf stats define each handicap level helps you set measurable and realistic targets in each area of your game.
This analysis of 3,788 rounds from 1,116 golfers shows the average playing stats across six handicap levels—from scratch golfers to 25 handicaps, as well as the minimum and elite ranges (10th to 90th percentile) that define each handicap level.
You can have a quick scan of the chart, or dive into the numbers and see where your golf game stacks up. If you are outside the shaded orange areas on the chart, you could reach that target handicap, but it’s highly unlikely.
Note: This data includes a mix of male and female golfers (est 75:25 split). We haven’t tracked this in the app, but we will look to in the future so we can provide even better analysis for male and female golfers.
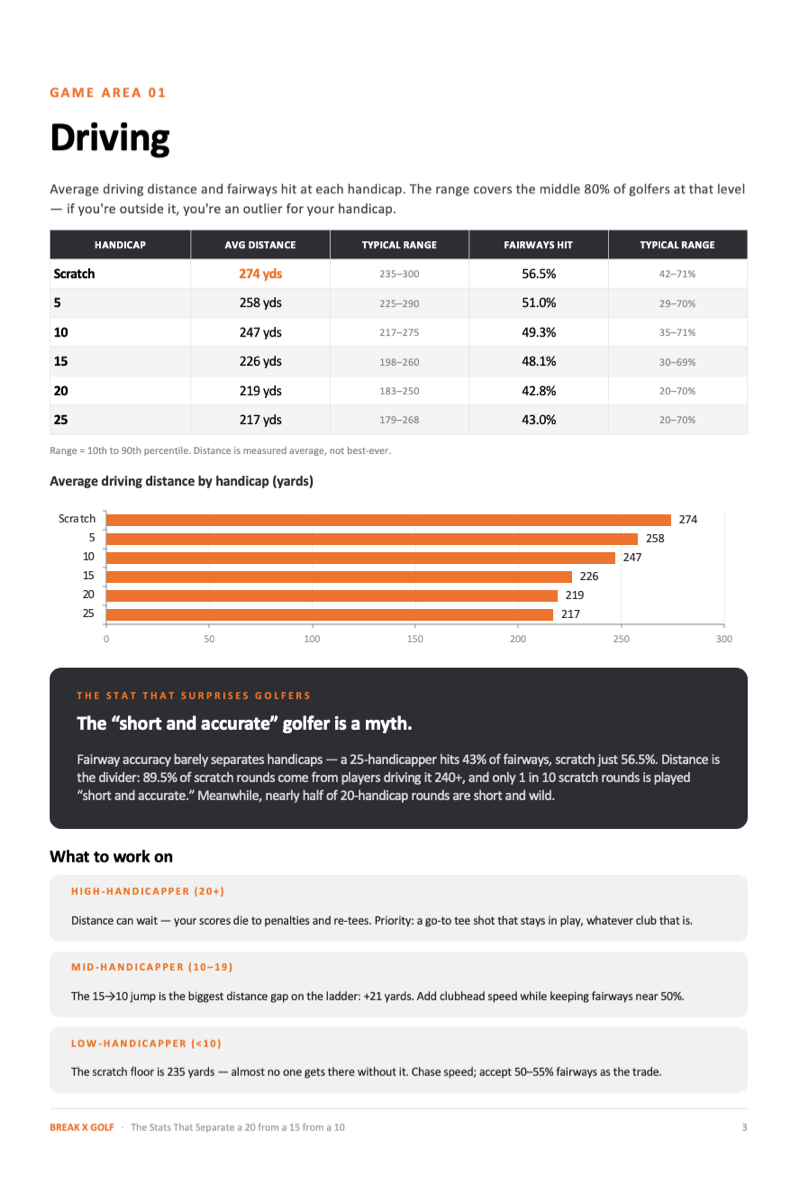
Driving Distance: 57-Yard Gap from Scratch to 25 Handicap
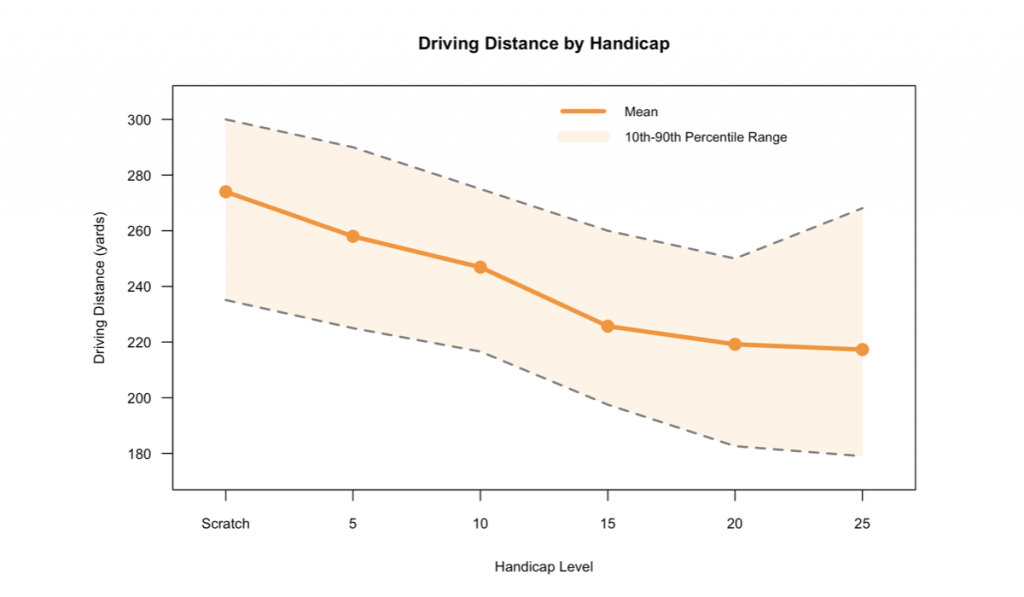
Scratch golfers average 274 yards off the tee, whilst 25 handicappers average 217 yards—a 57-yard difference. The gap narrows through the middle handicaps: 5 handicaps hit 258 yards, 10 handicaps 247 yards, 15 handicaps 226 yards, and 20 handicaps 219 yards.
Distance clearly reduces with higher handicaps, but the variance at every level is substantial. Scratch golfers range from 235 to 300 yards, whilst 25 handicaps span 179 to 268 yards. This shows distance alone doesn’t determine handicap—a 25 handicapper hitting 268 yards still has other areas limiting their scoring.
But when you look at the lower trend line, you can see that the minimum distance required to play at a given handicap increases from 20, down to 15, 10, 5 and then scratch.
Min driving distance (10th percentile):
- Scratch = 235 yards
- 5 Handicap = 225 yards
- 10 Handicap = 216 yards
- 15 Handicap = 198 yards
- 20 Handicap = 183 yards
- 25 Handicap = 179 yards
Key takeaway: You don’t need to hit it 300 yards to reach scratch, but you will struggle if you average less than 235 yards off the tee.
Fairway Accuracy: The Angular Control Challenge
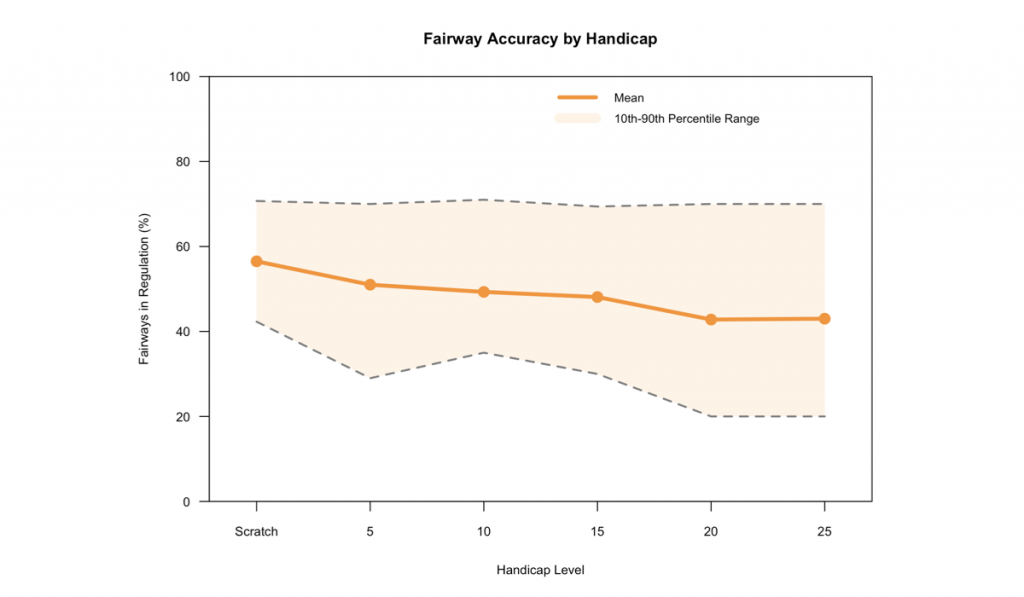
Fairway accuracy shows a modest decline from scratch (56.5%) to 25 handicap (43.0%) — just 13.5%. Scratch golfers hit 56.5% of fairways, 5 handicaps 51.0%, 10 handicaps 49.3%, 15 handicaps 48.1%, 20 handicaps 42.8%, and 25 handicaps 43.0%.
However, the real skill is in maintaining 56.5% fairways hit at 274 yards, rather than at 220 yards. This requires increasing angular accuracy by 25% (3.9º error down to 3.1º error). You can read more about this data here.
This requires better club face and swing path control, along with a consistent strike and allowing for your shot shape given where you aim. Scratch golfers aren’t just longer—they’re more accurate at distance, which compounds their advantage.
Key takeaway: To reduce your handicap, you need to increase distance while maintaining fairways hit. To do this, you need to improve your angular error. Average angular error improves by 25% from 25 handicappers to scratch golfers.
Yes, but some Low Handicap golfers are short and accurate…
No, not really.
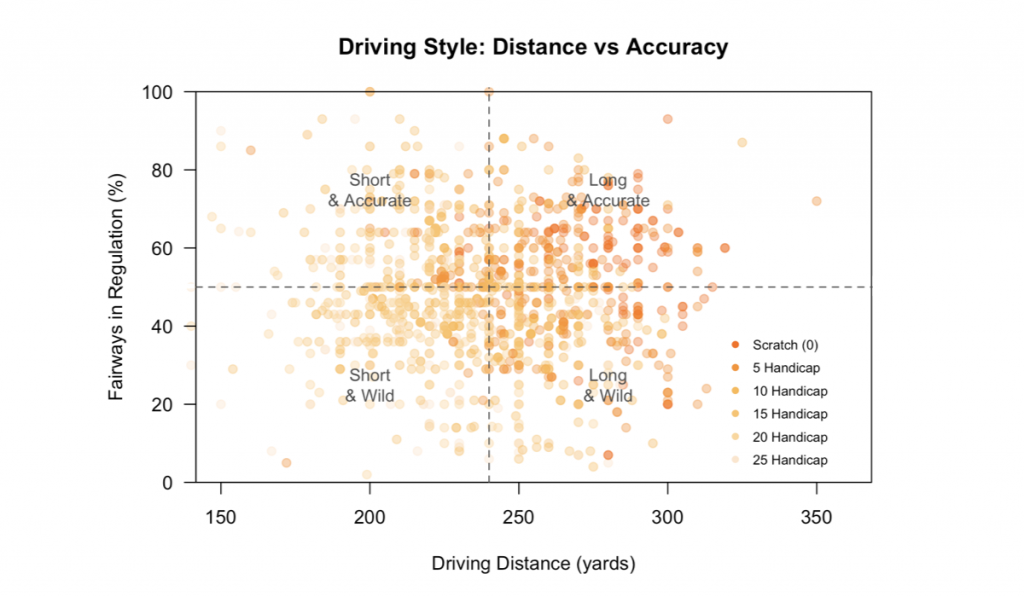
The graph above paints a nice picture of driving performance entered into Break X Golf at a round level. As expected, there are many dark orange dots (scratch golfers) in the top right, but where it gets interesting is looking at the top left vs the bottom right-hand quadrants.
Distance Dominates at Elite Levels
- 89.5% of scratch golfers rounds are “bombers” (66.4% accurate, 23.1% wild)
- Only 10.4% of round entries are “Short & Accurate” – this style barely exists at scratch!
- 80% of 5-handicapper rounds are bombers too
The Distance Advantage Disappears as Handicap Rises
- 10 Handicap: 64.5% bombers
- 15 Handicap: 31.5% bombers
- 20 Handicap: 23% bombers
- 25 Handicap: 31% bombers
High Handicappers = “Short & Wild”
- 48.7% of 20-handicapper rounds are short AND wild (worst of both!)
- Only 4.3% are long & accurate
Key takeaway: If you are a higher handicap, focus on getting the ball in play, no matter how far it goes. As you aim to become a single-figure handicap and scratch, make sure you can average 250 yards off the tee while maintaining accuracy. Averaging less than 250 yards makes it rather challenging to reach a 5 handicap or scratch.
Greens in Regulation: The Defining Stat
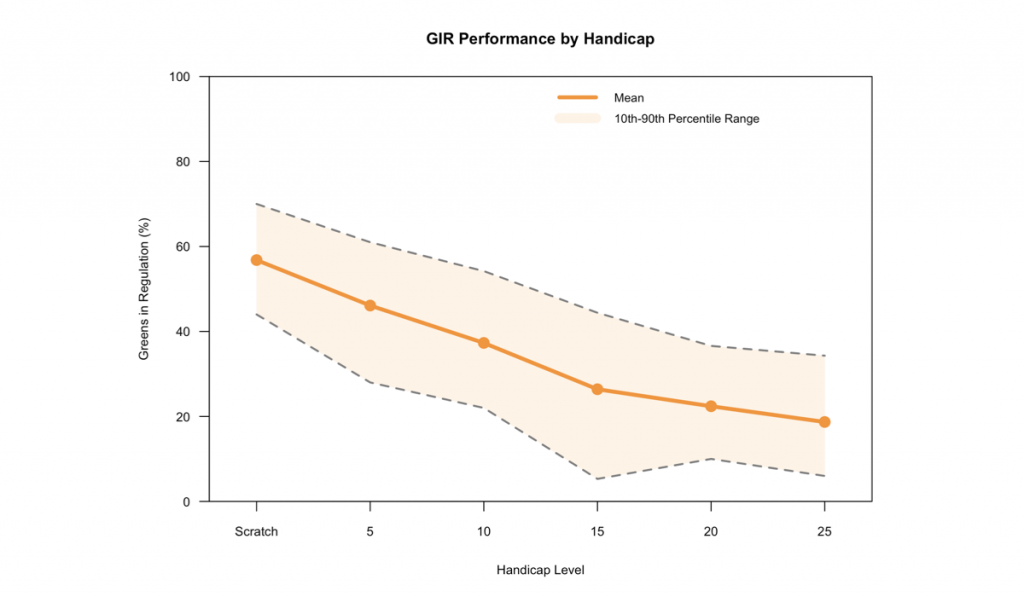
Greens in regulation separate handicaps more than any other metric—a 38.1 percentage point gap from scratch to 25 handicap. Scratch golfers hit 56.8% of greens, 5 handicaps 46.1%, 10 handicaps 37.3%, 15 handicaps 26.4%, 20 handicaps 22.4%, and 25 handicaps just 18.7%.
You can also see much tighter ranges (oranges shaded areas), showing there is less overlap in greens in regulation between handicap ranges.
Hitting more greens in regulation translates into more birdies putts, but more importantly, it really reduces the chance of making a bogey, double bogey (or an 11).
Scratch golfers hit 10 greens per round on average, giving them makeable birdie and par putts. A 15 handicap hits fewer than 5 greens, meaning they’re scrambling 13+ times per round. Even a great short game can’t consistently overcome that mathematical disadvantage.
Key takeaway: Hitting more greens is the number one stat for predicting handicap. It is a product of long, straight driving and accurate approach play…so it’s not easy to excel at. But a quick and simple tip is to forget the flag and just find a way to hit the green when you have a chance.
Short Game: Everyone Struggles, But Better Players Scramble More
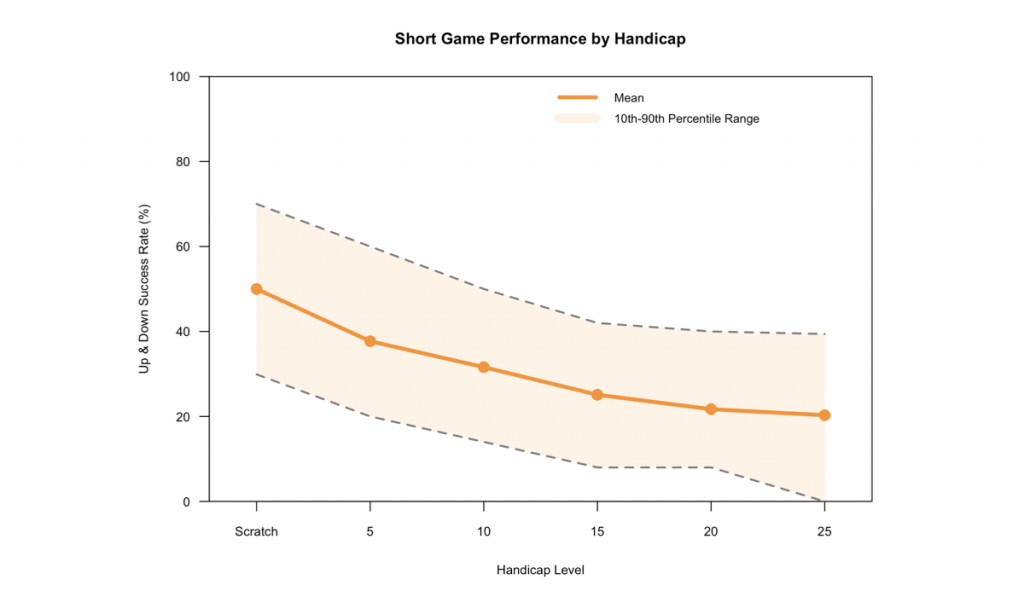
Up-and-down success rates show steady decline: scratch golfers succeed 50.0% of the time, 5 handicaps 37.7%, 10 handicaps 31.6%, 15 handicaps 25.1%, 20 handicaps 21.7%, and 25 handicaps 20.3%.
Even scratch golfers only get up and down half the time—short game is difficult for everyone. The 30-point gap from scratch to 25 handicap matters, but it also shows realistic expectations. You don’t need 80% scrambling to play scratch golf; you need 50%, paired with hitting more greens.
Key takeaway: Short game still matters. The more greens you miss, the more short game ability will impact your scoring.
Putting: The Hidden Improvement Beyond The Data
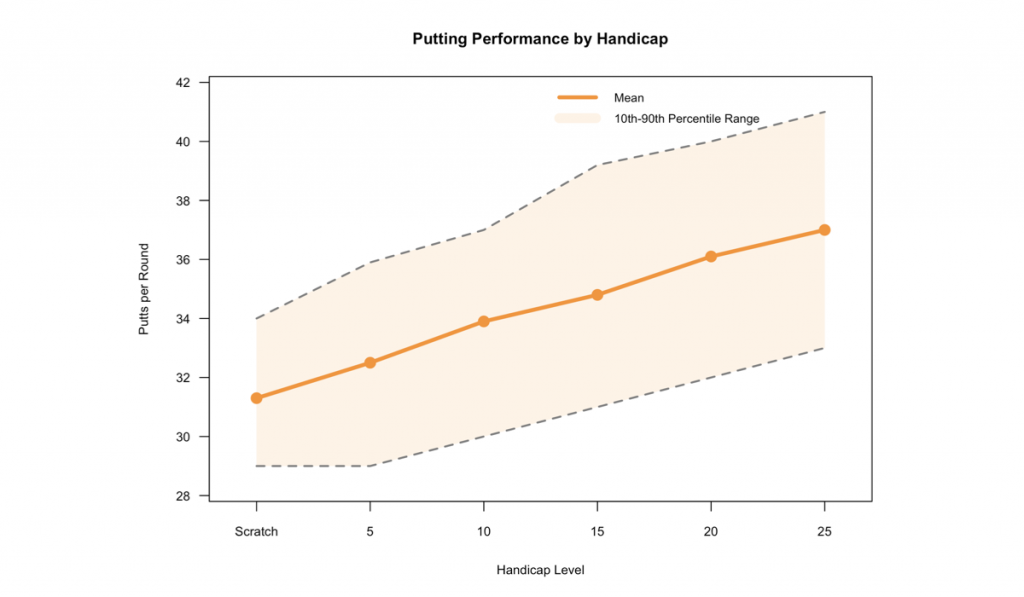
Putts per round shows the smallest raw gap: scratch golfers average 31.3 putts, whilst 25 handicaps average 37.0 putts—just 5.7 putts difference. The progression is steady: 5 handicaps 32.5, 10 handicaps 33.9, 15 handicaps 34.8, and 20 handicaps 36.1.
However, this undersells putting improvement because it ignores first putt distance. Scratch golfers have more mid and long range first putts after hitting 10 greens, whilst 15 handicaps will often putt from 10 feet and in after scrambling.
The raw number suggests putting will only save you 5.7 shots, but in reality, if a scratch golfer putted for a 25 handicap golfer, they would likely save 8-10 shots.
Key takeaway: Driving and approach play make up most of the shot difference between a 25 and scratch handicap golfer, but putting is one of the quickest skills to improve at, and could save you a large chunk of shots if you can get to a scratch level.
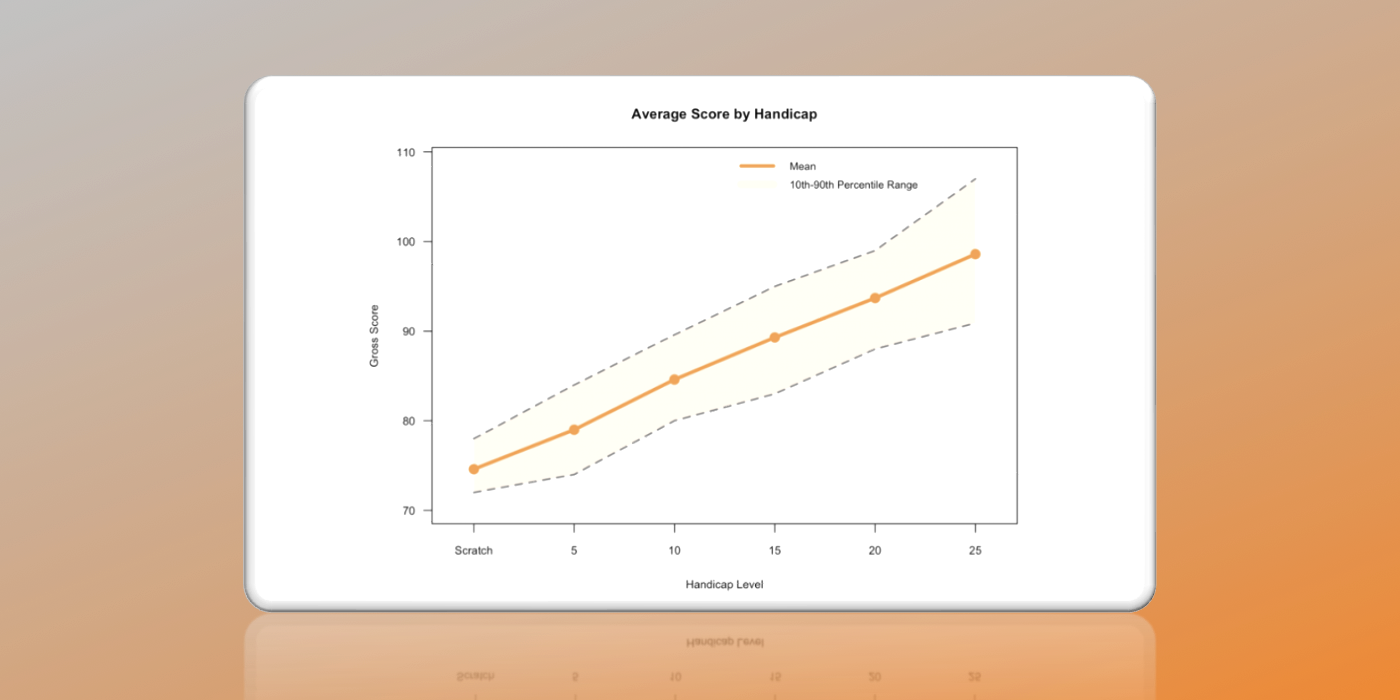
Average Score: Consistency Over Perfection
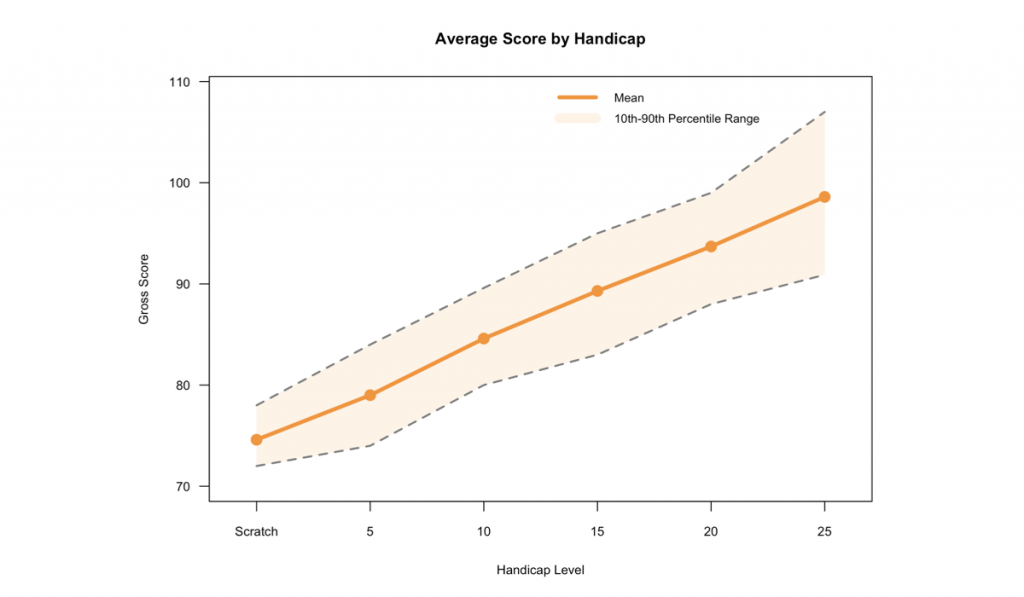
Average scores show linear progression: scratch golfers shoot 74.6, 5 handicaps 79.0, 10 handicaps 84.6, 15 handicaps 89.3, 20 handicaps 93.7, and 25 handicaps 98.6.
The scoring ranges reveal an important truth: scratch golfers don’t shoot level par every round—they typically shoot par or better 10% of the time.
Key takeaway: All golfers want to be more consistent, but the reality is that all golfers show higher variance than they would like.
Summary
Strokes gained data is still the best way to understand how you play golf and how to improve, but the beauty of traditional golf stats is that they are easy to picture and understand.
This analysis shows you the average numbers you need to hit to reach your handicap goal, but it also shows you the range that 80% of golfers fit into.
Happy golfing – Will @ Break X Golf
Golf Stats By Handicap Summary Table
| Handicap | Avg. Score | Driving Distance | FIR (%) | GIR (%) | Up & Down (%) | Putts |
| Scratch (0) | 74.6 | 274 yds | 56.5% | 56.8% | 50.0% | 31.3 |
| 5 | 79 | 258 yds | 51.0% | 46.1% | 37.7% | 32.5 |
| 10 | 84.6 | 247 yds | 49.3% | 37.3% | 31.6% | 33.9 |
| 15 | 89.3 | 226 yds | 48.1% | 26.4% | 25.1% | 34.8 |
| 20 | 93.7 | 219 yds | 42.8% | 22.4% | 21.7% | 36.1 |
| 25 | 98.6 | 217 yds | 43.0% | 18.7% | 20.3% | 37 |
Want to track your playing stats and build a personalised practice plan to hit these targets? Break X Golf creates custom practice plans based on your actual performance data.