The goal of Break X Golf is to help you lower your handicap in the most effective way possible.
We built the app on solid scientific principles, and we aim to keep developing it based on data.
I’ve just spent the last few weeks analysing the performance data collected over the past 24 months. Here’s what we found:
91% of golfers who commit to two simple habits drop an average of 3.96 shots from their handicap.
What are those two habits?
- Complete 6 Break X Golf practice activities per week
- Enter playing stats from 4 rounds per month
Not rocket science, but it proves that consistent practice on targeted areas + regularly entering playing stats works. It’s also great to put some real numbers to the concept of deliberate practice in golf.
Here’s what the data shows us about how to lower your handicap.
A Quick Note On The Data
The data is messy. We have a 7-day free trial. Many golfers sign up, look around, and never use the app again. Some subscribe for a month or two and complete 1-2 tasks. If users don’t enter a second round of playing stats, we have no way to detect handicap improvement.
What this means: The following analysis is based on all users who enter two or more rounds of playing stats. They may have been with us for a week or two years. All data is averaged over their time with us, so we can’t tell how consistent their practice is. Over time, we’ll continue to improve our data tracking and the app to generate better insights.
Why Both Practice & Playing Stats?

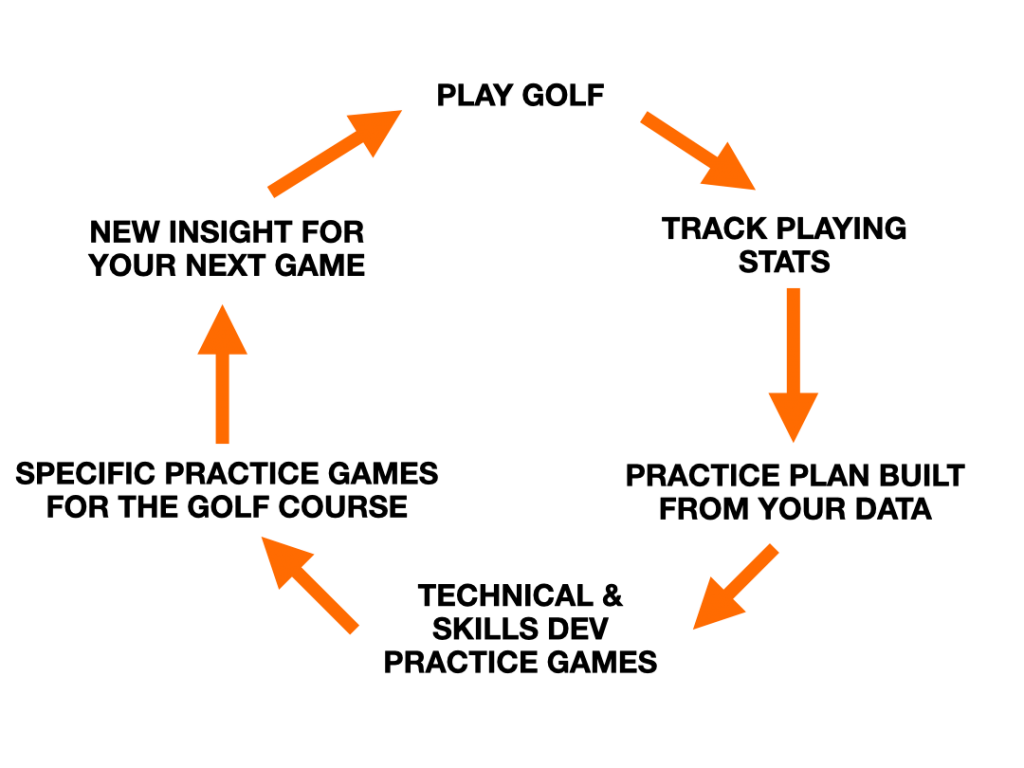
Here’s the performance cycle I’ve shared for many years: how most golfers practice (left) versus the Break X Golf framework (right).
Practice builds skills. Skills games give you focused reps on specific areas holding your game back. You get clear, immediate feedback on your shot outcome. You improve your skill level and build confidence in measurable, relevant activities.
Playing measures performance. Playing golf and entering your playing stats helps you practice scoring. Critically, it feeds data back into your practice plan to keep it up to date.
It’s tricky to objectively update your practice based on how you play (even as a coach). I’m really proud of how well the app does this*.
* We have some exciting plans to improve this further this winter.
Improvement Rate In Break X Golf
Below is the percentage of users who improve in the app, categorised by:
- How many rounds of playing stats they enter
- How many practice activities they complete
- How long they stay a member
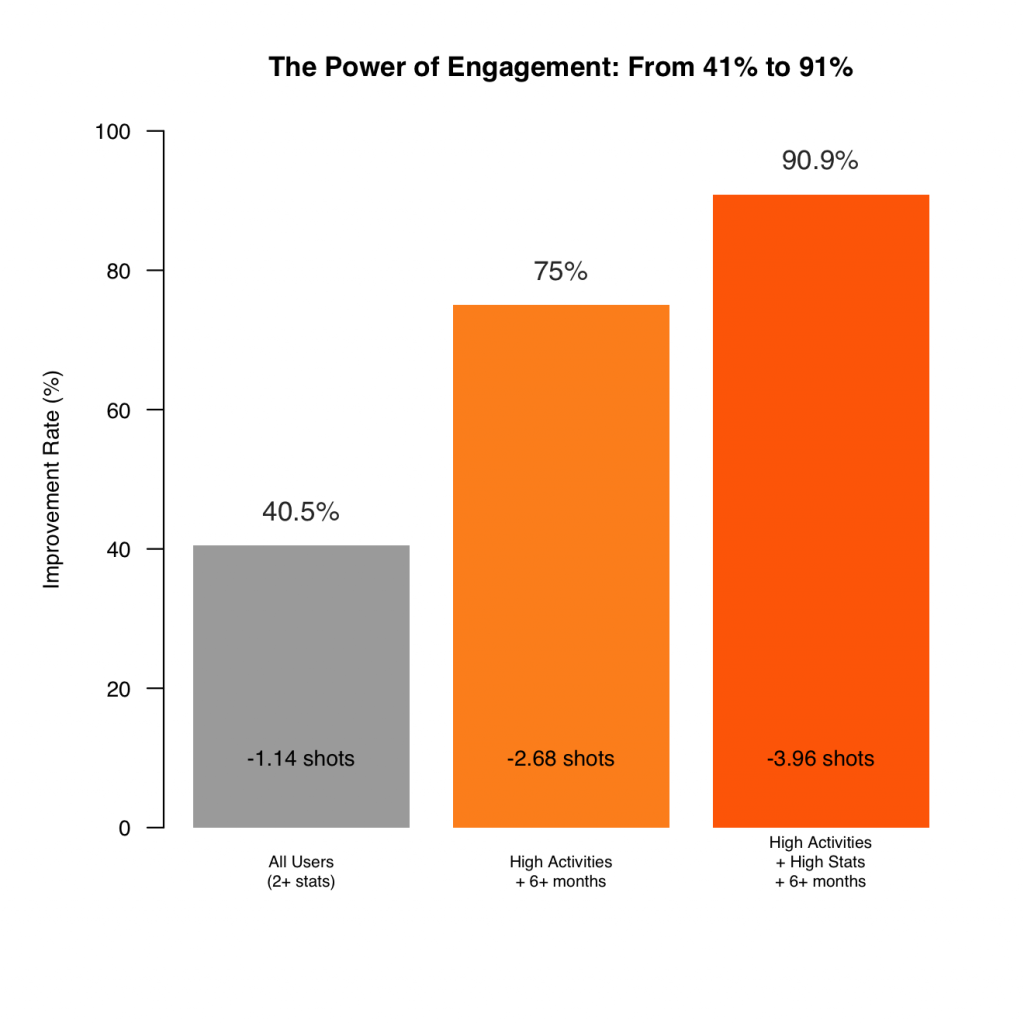
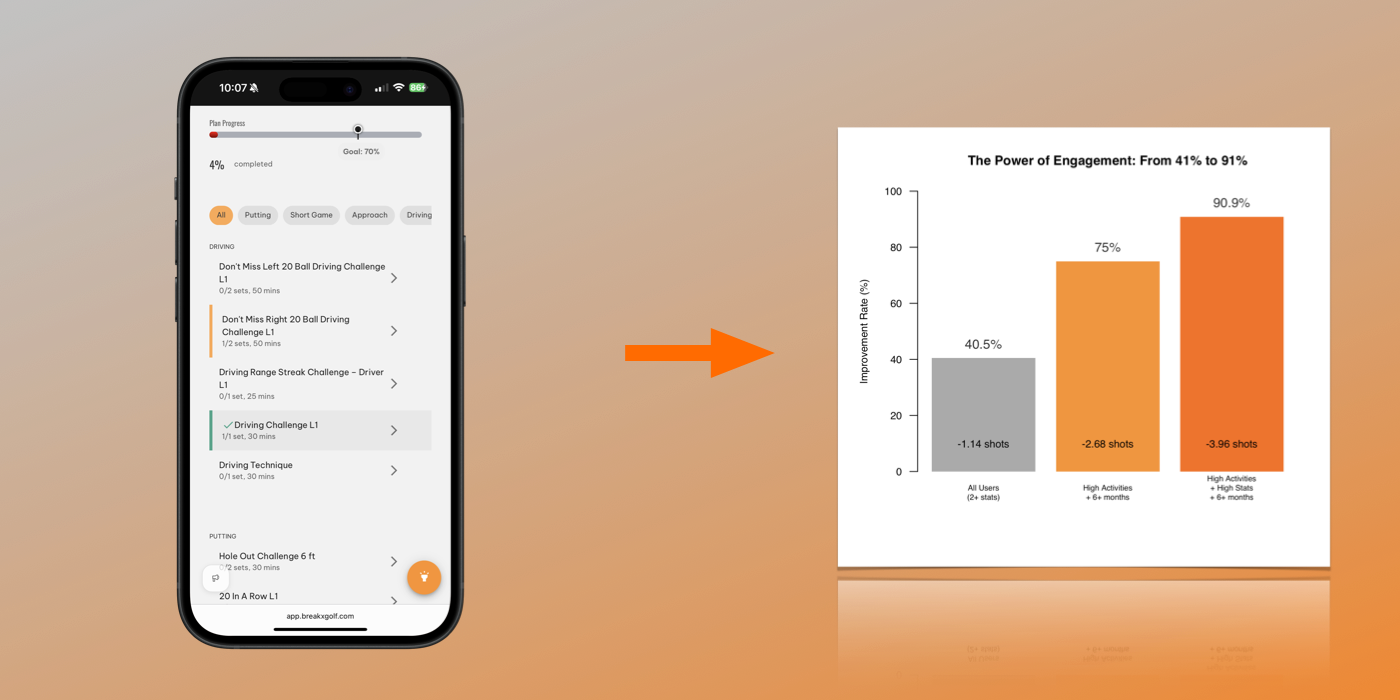
41% of users who enter at least 2 rounds see some improvement. That’s encouraging – just using Break X Golf and tracking your game helps.
But when golfers commit to high practice activity for 6+ months, their success rate jumps to 75% and their average handicap improvement more than doubles to -2.68 shots.
When golfers combine high practice activity + regular stat tracking for 6+ months, the success rate hits 91% with nearly 4 shots off their handicap on average.
What “Engagement” Actually Means
The data is messy (non-parametric, different group sizes and variance). A simple but effective approach is to split it into quartiles, then look at low, med-low, med-high, and high groups for entering playing stats, generating plans, and completing practice activities. Then see how much each group improves.
Here are the averages for the group where 91% of golfers improved:
High Activities: Completing 23.8 practice activities per month (5.5 to 6 per week). Not beating hundreds of balls at the range – focused practice targeting your weak areas (Driving, Approach, Short Game, or Putting).
High Playing Stats: Entering data for 4.3 rounds per month (roughly one entry per week). Enough to track trends without it feeling like homework.
Time: 6 months. Your handicap won’t drop overnight. Golfers still have to enter competition/handicap qualifying rounds, but an average reduction of 3.96 across all handicap ranges is a solid improvement. We cover the limitations of measuring time in this study as we wrap up this article.
Does Lower Engagement Still Work?
Yes. Golfers still improve with fewer practice activities, but more weekly activities result in a higher chance of improvement and a larger average handicap drop.
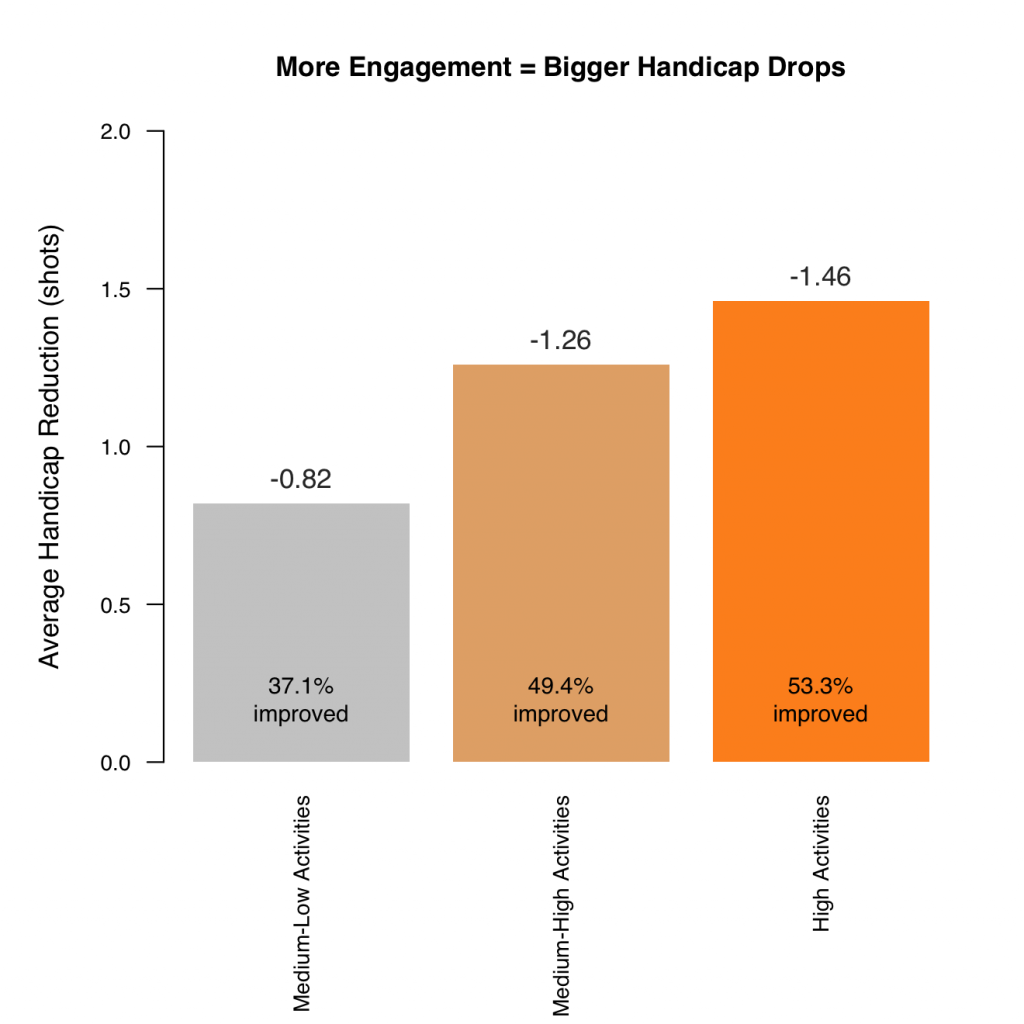
Averages for each group:
- Medium-Low = 1.3 practice activities/month
- Medium-High = 4.2 practice activities/month
- High = 23.8 practice activities/month
The pattern is clear: the more you engage with your practice plan, the more likely you are to improve and the larger the average handicap drop.
Key message For Lowering Your Handicap
If you want to lower your handicap:
- Enter playing stats four times a month. This keeps your practice plan focused on the biggest potential wins.
- Complete 5-6 practice activities per week. Specific, focused practice, with clear feedback, will improve your skill level.
Some weeks you may manage 10 activities, other weeks only two. The higher you can get your average over a longer period, the greater your chance of improvement and handicap drop.
The Break X Golf app orders your practice plan by priority, so the areas most holding you back are at the top. If in doubt, start with these tasks first each week.
Limitations Of This Study
Measuring when handicaps dropped and how consistently golfers practised over time is something we can’t analyse in this study (planned for the next one).
We know how long each golfer has been with us (hence we can filter by 6+ months), but their handicap may have dropped after just 3 months or after 6-12 months. Looking at the data for golfers who have been with us 3 to 6 months, it’s clear that many golfers see improvement earlier than 6 months, and some will be after 6 months.
We haven’t got enough data to filter the findings above down into handicap groups (<5, 5-10, 11-20… handicaps), but this will be a focus when we have more members (hopefully we keep growing). As you would expect, higher handicappers make larger handicap drops on average, but a larger percentage of mid and low handicappers improve…
| Handicap Group | Percentage Who Improved (%) | Average Handicap Improvement |
| Low Handicap (<12) | 42.6 | 0.63 |
| Mid Handicap (12-20) | 42 | 0.87 |
| High Handicap (20+) | 36.2 | 2.1 |
This really interests me. I have a hunch why this is, but I’d love to get your thoughts if you fall into one of these categories.
What We’re Learning
Here’s what I’m taking away from this analysis:
- The system works. When golfers commit to practice + tracking, 91% see results.
- Engagement is everything. The difference between low and high practice activities matters most, closely followed by entering playing stats.
- We need to make engagement easier. The current friction points – remembering to track playing stats, entering playing stats, planning practice, matching plans to practice facilities (or lack of), helping you practice with limited time & staying motivated through plateaus – are our responsibility to make easier for you.
The exciting news is there’s a lot more we can add to help you practice more effectively. We need to balance this with keeping the app simple and easy to use.
I hope you’ve enjoyed this read. We’ll keep improving the app based on this data and keep sharing insights with you as we improve our data analysis. As always, just get in touch via email if you have any questions or thoughts and feedback to share.
PS – if you’re reading this and you’re not currently a member, feel free to start your 7-day free trial and start checking off some practice games.
Happy golfing –Will Shaw @ Break X Golf