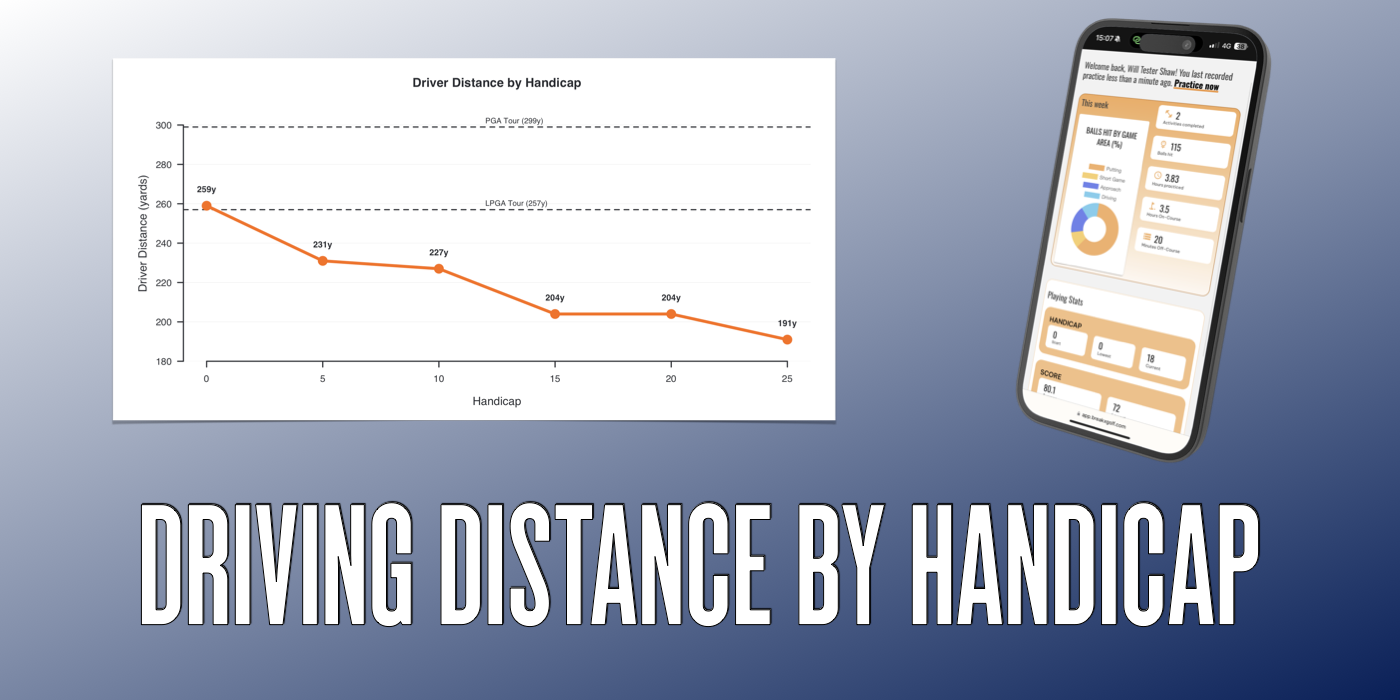
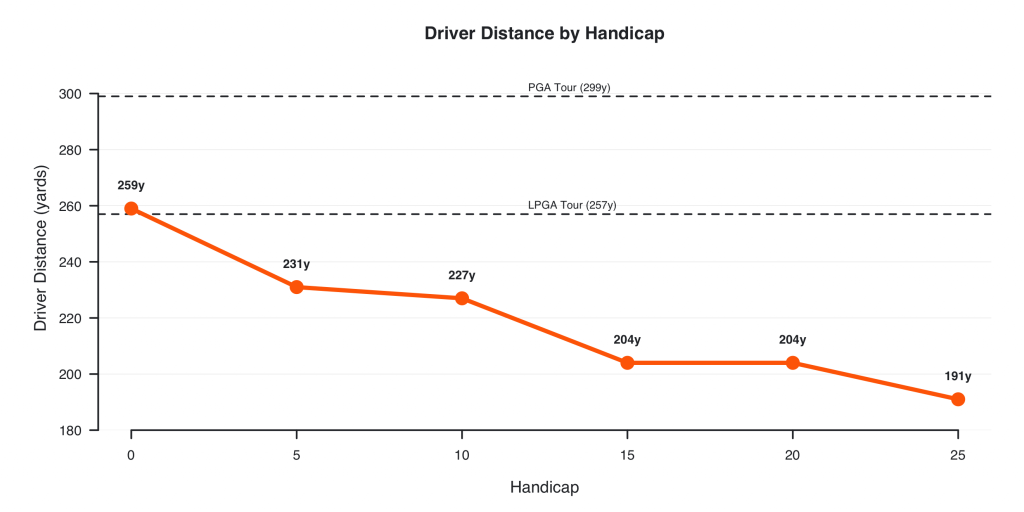
Understanding how driver distance varies across handicap levels reveals surprising patterns about what truly separates elite players from higher handicappers. This data, compiled from thousands of rounds across handicap levels from scratch to 25, shows that distance drops as handicap increases—but not in the way most golfers expect.
📊 Key Findings Across All Handicaps:
Scratch golfers average 259 yards off the tee, whilst 25 handicappers average 191 yards—a 68-yard gap. But the relationship isn’t linear. The biggest drop occurs between scratch and 5 handicap (28 yards), then minimal change between 5 and 10 handicap (just 4 yards), before another significant drop to 15 handicap (23 yards). From 15 to 20 handicap, distance stays identical at 204 yards, before the final drop to 25 handicap.
Perhaps most surprisingly, fairway accuracy remains remarkably consistent across all handicap levels, ranging from 45-50%. This proves that hitting fairways isn’t the primary differentiator between handicap levels.
However, this statistic requires careful interpretation: whilst 25 handicappers hit 47% of fairways compared to 46% for scratch golfers, they’re achieving this with 191 yards average driving distance rather than 259 yards. Angular accuracy tells the real story.
Angular Accuracy: The Hidden Insight
When you account for distance, lower handicappers are significantly more accurate. A scratch golfer hitting 259 yards with a 14-yard miss is just 3.1° offline. A 25 handicapper hitting 191 yards with a 13-yard miss is 3.9° offline—26% less accurate in terms of angle. This means that as players gain distance, they’re proportionally more accurate, creating shorter approach shots with tighter dispersion.
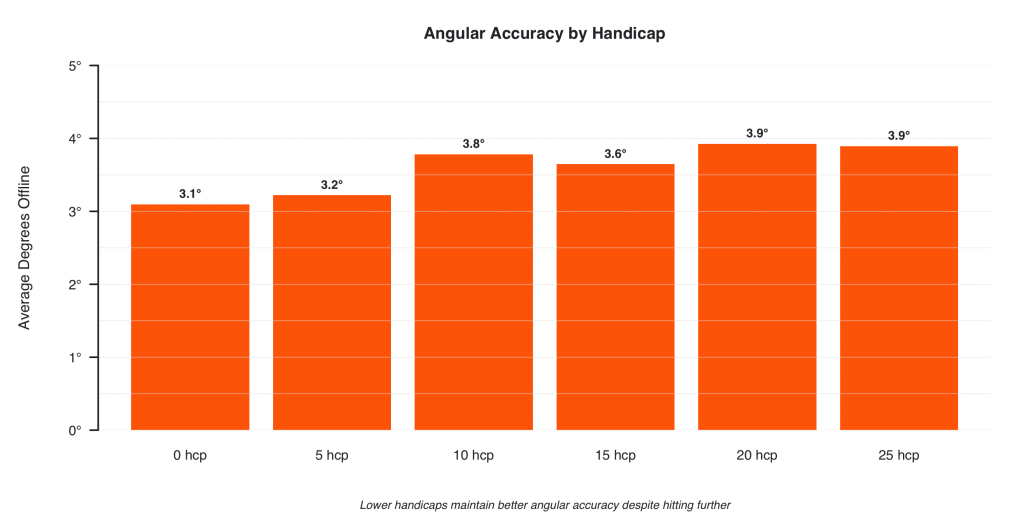
The data shows that improving golfers need both distance and directional control. Raw fairway percentage alone doesn’t reveal skill level; angular accuracy combined with distance does. This is why a 10 handicapper hitting 227 yards at 3.8° offline has a massive advantage over a 25 handicapper hitting 191 yards at 3.9°—despite nearly identical angular error, the extra 36 yards creates dramatically shorter approach shots.
EXPLORE BY HANDICAP LEVEL
Dive deeper into detailed benchmarks for your handicap:
- Scratch Handicap Driving Stats – 259 yards, 3.1° angular accuracy
- 5 Handicap Driving Stats – 231 yards, 3.2° angular accuracy
- 10 Handicap Driving Stats – 227 yards, 3.8° angular accuracy
- 15 Handicap Driving Stats – 204 yards, 3.6° angular accuracy
- 20 Handicap Driving Stats – 204 yards, 3.9° angular accuracy
- 25 Handicap Driving Stats – 191 yards, 3.9° angular accuracy
TRACK YOUR STATS VS THESE BENCHMARKS
Knowing where you stand against these benchmarks is just the starting point. Break X Golf uses your actual playing stats to build personalised practice plans that target your biggest scoring opportunities—helping you understand whether you need to prioritise distance, accuracy, iron play, or short game to reach your target handicap.