Short answer: The average US golfer who keeps score shoots 94, and only about 1 in 10 average under 80 (National Golf Foundation, 2024). Around half of men with a handicap play to a level that averages under 90. Even scratch golfers average 74.6 in our data, so breaking 70 regularly takes a plus handicap, and under 2% of men have one (USGA).
What percentage of golfers break 100, 90, 80 and 70?
| Score | How many golfers do it regularly | Source |
|---|---|---|
| Break 100 | The typical golfer who keeps score (average score is 94) | NGF, 2024 |
| Break 90 | About half of men with a handicap (around 56% are 14.9 or better) | USGA handicap data + Break X Golf scores |
| Break 80 | About 1 in 10 | NGF, 2024 (about 11% of men and 2% of women are 4.9 or better) |
| Break 70 | Under 2% | USGA: only 1.85% of men have a plus handicap |
The NGF figure comes from around 20 million US golfers who keep score, about 77% of all golfers. The handicap figures come from USGA data on registered handicaps, which skew better than golfers as a whole because keen golfers are the ones who keep a handicap.
To turn handicaps into scores, we used rounds tracked in the Break X Golf app. In our data a 15 handicap averages 89.3 and a 5 handicap averages 79.0.
So “breaks 90 on average” lines up with roughly a 15 handicap or better, and “breaks 80 on average” with roughly a 5 or better. That handicap-based estimate for under 80 (about 1 in 10 men) matches the NGF’s own figure.
Why do the numbers you see online disagree?
Articles on breaking 80 quote anything from 5% to 20%. Three things explain most of the spread:
- “Ever” vs “regularly”. Lots of golfers have broken 90 once. Far fewer do it most rounds.
- Who’s counted. Handicap holders are better than golfers who don’t keep a handicap, and both are better than golfers who don’t keep score at all.
- Self-reported scores. Gimmes, mulligans and forgotten penalty shots make scores look a little better than they are. The NGF notes this about its own numbers.
Treat any single percentage as a rough guide. The more useful question is how often golfers at your level break each number.
How often golfers at your handicap break 100, 90 and 80
Pick your handicap to see how often golfers at that level break each score, and where the shots to the next level come from.
Your odds by handicap
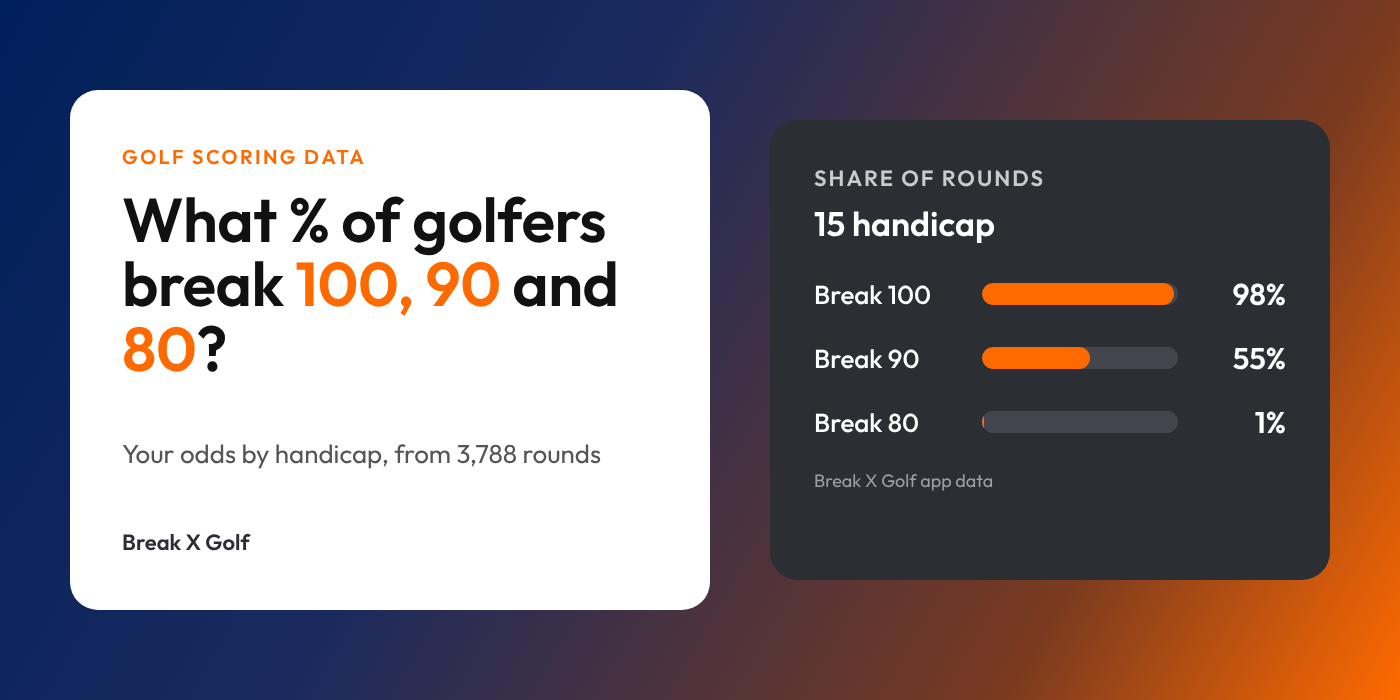
How often do golfers at your handicap break 100, 90 and 80?
Share of rounds that
Next step: tour level (5.0 shots a round)
Scratch golfers still lose most to a tour pro with approach shots and the driver.
Share of rounds that
Next step: scratch (5.4 shots a round)
The jump from 5 to scratch is mostly approach play and driving, close to 4 shots between them.
Share of rounds that
Next step: 5 handicap (3.7 shots a round)
5 and 10 handicaps drive it about the same. Half the gap is approach play.
Share of rounds that
Next step: 10 handicap (5.5 shots a round)
A 15 handicap breaks 90 in just over half their rounds. Approach play is the biggest single gap to a 10.
Share of rounds that
Next step: 15 handicap (4.5 shots a round)
About 1 round in 8 goes under 90. Approach and short game make up most of the gap to a 15.
Share of rounds that
Next step: 20 handicap (4.2 shots a round)
A 25 handicap breaks 100 about half the time. The driver is where the next 2 shots are (small sample at this level).
Scores and break rates: 3,788 rounds tracked in the Break X Golf app. “Next step” = strokes gained gap to the next handicap band, from 319 rounds (Oct 2026). Want this for your own game? Break X Golf shows where your shots go.
A few things stand out from 3,788 rounds:
- Breaking 90 is a coin flip for a 15 handicap. They do it in 55% of rounds. A 10 handicap does it 9 times out of 10.
- “Ever” is much easier than “regularly”. A 20 handicap breaks 90 in about 1 round in 8. Over a season of 20 rounds, that’s two or three sub-90 rounds on average.
- Breaking 80 is where it gets hard. A 10 handicap breaks 80 in fewer than 1 round in 10. A 5 handicap does it in about 6 rounds out of 10.
What separates 90s, 80s and 70s golfers?
When we split 435 rounds into 70s, 80s and 90s shooters, approach play was the biggest single difference at both steps:
- 90s to 80s: a 7.8-shot gap, and about half of it (51%) comes from approach shots. Short game is the next biggest chunk at 25%. 90s shooters hit 20% of greens in regulation; 80s shooters hit 36%.
- 80s to 70s: a 9.5-shot gap, with approach the largest single part (40%). Greens in regulation climb to 57%.
- Big numbers: 90s shooters make about 6.5 double bogeys or worse a round. 80s shooters make about 3.1, and 70s shooters fewer than 1.
From my coaching experience, golfers just don’t know where they are losing shots. As a result, they have little idea what to practice. This is why tracking some rounds with Break X Golf is so handy; it tells you what is holding you back and where to focus your practice time.
How long does it take to break 90?
There’s no fixed timeline. Two things make the biggest difference in our data: time, and how often you practice with a plan.
Across 3,788 rounds from 1,116+ golfers in the app, 22.7% had improved their handicap after 1–2 months of tracking, rising to 56.9% after 12 months or more. Golfers who logged 8+ practice or stats activities a month improved more often (53.3%) than those with low engagement (22.2%).
If you can track your stats, practice what’s holding you back and have 1-2 coaching sessions on the areas costing you shots – you will fly! We’ve seen a few cases of this with Break X Golf users: A golfer, Lee, went from a 54 handicap to 18 handicap in just over 1 year, around a full-time job. Another younger golfer went from an 18 handicap to 4 in a year, with some good coaching and practising a lot of skills games.
So the timeline and level of improvement can be very high when you form the right habits.
What about women golfers?
The USGA’s average handicap for women is 28.0, against 14.1 for men (2022), and only about 2% of women are 4.9 or better (NGF). Breaking 80 is rarer still for women due to this average difference in handicap, and breaking 90 is a strong score.
FAQ
Is breaking 90 good?
Yes. A round in the 80s beats the US scoring average of 94, and doing it every time puts you in roughly the better half of men with a handicap.
What handicap is the top 1% of golfers?
Fewer than 2% of men (1.85%) and under 1% of women (0.69%) have a plus handicap, according to USGA data. So the top 1% of male golfers sit in plus handicap territory.
What is the average golf score?
94, for US golfers who keep score (NGF, 2024). That number is self-reported, so the true average is likely a little higher.
What percentage of golfers break 100?
In our data, 91% of rounds by 20 handicaps are under 100, and about half (54%) by 25 handicaps. With the US average at 94, a typical scorekeeper’s round is under 100.
Find out which shots stand between you and the next number
The averages above tell you what’s normal. They don’t tell you where your shots go.
Break X Golf works that out from your own rounds using strokes gained across driving, approach, short game and putting. Pick a goal (Break 90, 85, 80, then every 2 shots), and the app builds a 4-week practice plan around whatever costs you the most shots, with 30–90 minute sessions and skills challenges benchmarked to your handicap.
Related articles:
- Average golf scores by handicap
- How to break 90
- How to break 80
- How to break 100
- Golf stats by handicap
Sources: National Golf Foundation, “Who’s Keeping Score?” (2024). USGA handicapping statistics (2022). USGA handicap distribution via GOLF.com (2020). Break X Golf app data: 3,788 rounds (score by handicap) and 435 rounds / 118 golfers (scoring bands, Oct 2026).